Theoretical considerations
Level of significance
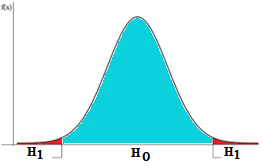
Hypothesis Testing is a way to test an idea or an assumption using data. It involves making two hypotheses: the Null Hypothesis (H0) and the Alternative Hypothesis (H1). The null hypothesis is usually a statement that there is no relationship between two variables or no difference between two groups. The alternative hypothesis is the opposite of the null hypothesis and represents the idea or assumption that you want to test. After collecting data you perform a statistical test to see if the data supports the null hypothesis or the alternative hypothesis. If the data provides enough evidence against the null hypothesis, you reject it and conclude that the alternative hypothesis is true. The level of significance is the probability, chosen by the user, that leads to the conclusion of the hypothesis test in favor of the alternative hypothesis (H1). Generally, we choose a very small level of significance, such as 5%, 2.5% or 1% of the total area under the probability density curve. For example, by choosing a 5% level of significance we are delimiting a region on the distribution curve in which, if H0 is true, we have a 5% chance of obtaining sample results falling within that area.

The significance level is the probability of rejecting the null hypothesis when it is true. Since this probability is very small, obtaining sample results in this area is a good indication that the null hypothesis may not be true. The researcher must choose the significance level before conducting the experiment. We can use the following comparison to have a better intuition of H0 and H1. In a court of law, the defendant is assumed to be innocent until proven guilty. This is similar to the null hypothesis in hypothesis testing which assumes that there is no relationship between two variables or no difference between two groups until there is enough evidence to suggest otherwise. esis Testing is a way to test an idea or an assumption using data. It involves making two hypotheses: the Null Hypothesis (H0) and the Alternative Hypothesis (H1). The null hypothesis is usually a statement that there is no relationship between two variables or no difference between two groups. The alternative hypothesis is the opposite of the null hypothesis and represents the idea or assumption that you want to test. After collecting data you perform a statistical test to see if the data supports the null hypothesis or the alternative hypothesis. If the data provides enough evidence against the null hypothesis, you reject it and conclude that the alternative hypothesis is true. The level of significance is the probability, chosen by the user, that leads to the conclusion of the hypothesis test in favor of the alternative hypothesis (H1). Generally, we choose a very small level of significance, such as 5%, 2.5% or 1% of the total area under the probability density curve. For example, by choosing a 5% level of significance we are delimiting a region on the distribution curve in which, if H0 is true, we have a 5% chance of obtaining sample results falling within that area.
Just as a prosecutor must present evidence to prove the defendant’s guilt beyond a reasonable doubt, a researcher must collect data and perform a statistical test to determine if there is enough evidence to reject the null hypothesis. If the evidence is strong enough, the null hypothesis is rejected and the alternative hypothesis is accepted, just as a defendant may be found guilty if the evidence against them is strong enough.
The power of a hypothesis test
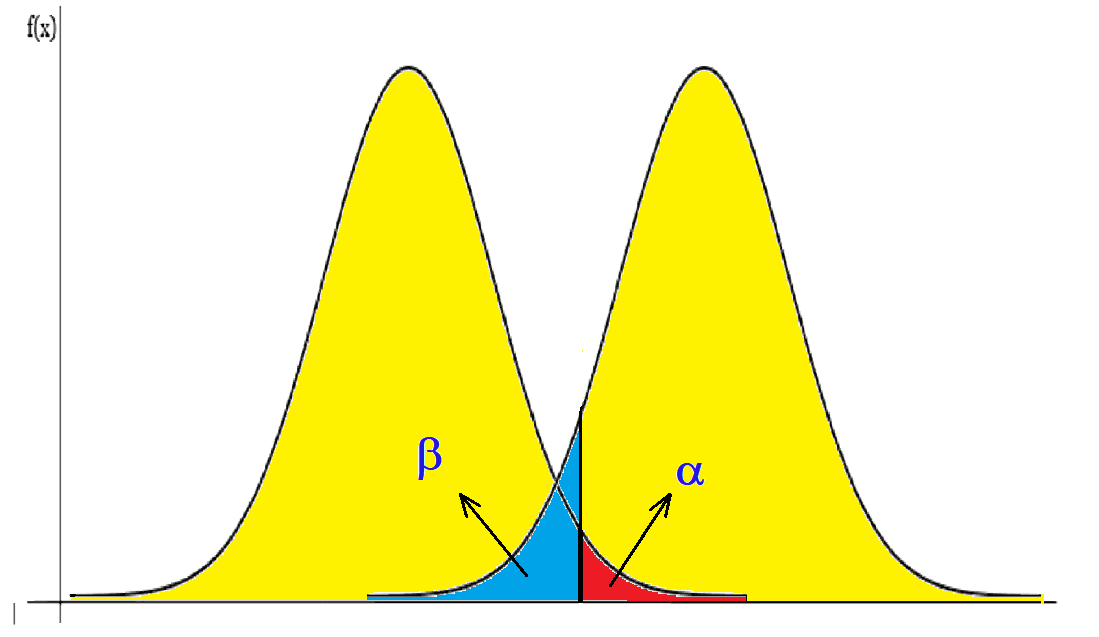
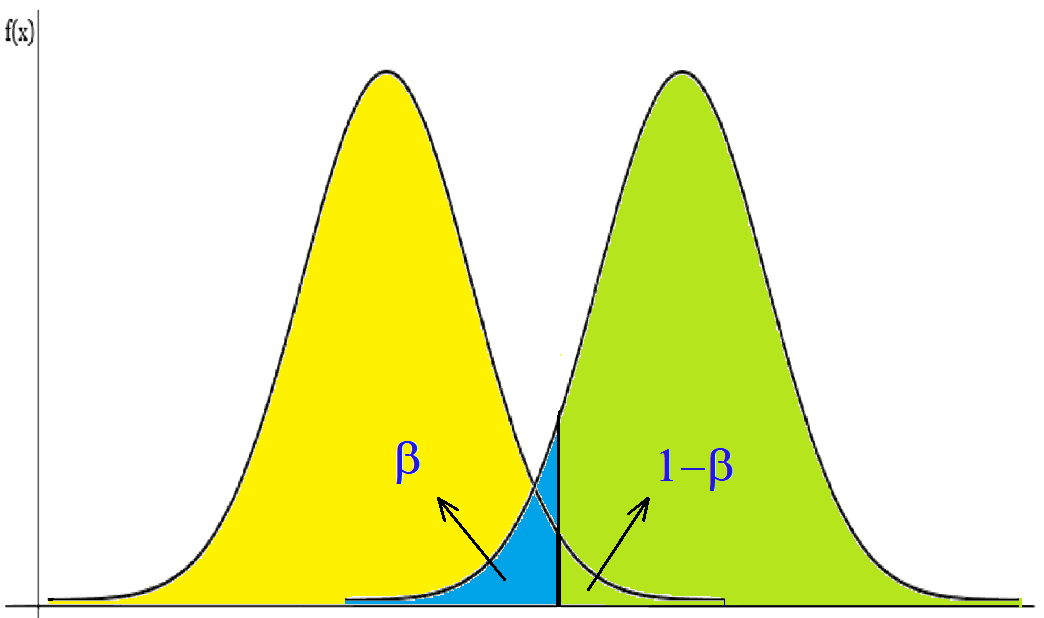
The power of a hypothesis test is how likely you are to avoid a type II error. The type 2 error is represented by the letter beta (β) which occurs when the statistical analysis of the data fails to reject a hypothesis, in case this hypothesis is false. In other words, it is how likely you are to say that your first guess is wrong when your second guess is right. The power of a test depends on some factors, such as how many times you try something, how big the difference is between the two guesses, and how sure you want to be. The power of a test can be from 0 to 1. A higher power means a lower chance of a type II error. A lower power means a higher chance of a type II error. You want a test with high power to ensure that your results are not just by chance. The power of a hypothesis test is obtained by subtracting the value of the Beta error from the total area under the probability density curve. Since the Type II error is the probability of not rejecting H0 when it is false, the power of the test represents the probability of correctly not rejecting H0. Therefore, if we have a Beta error value of 6%, the power of the test will be 94%. This means that we have a 6% probability of not rejecting H0 when we should have rejected it and a 94% probability of correctly rejecting H0.
The effect size
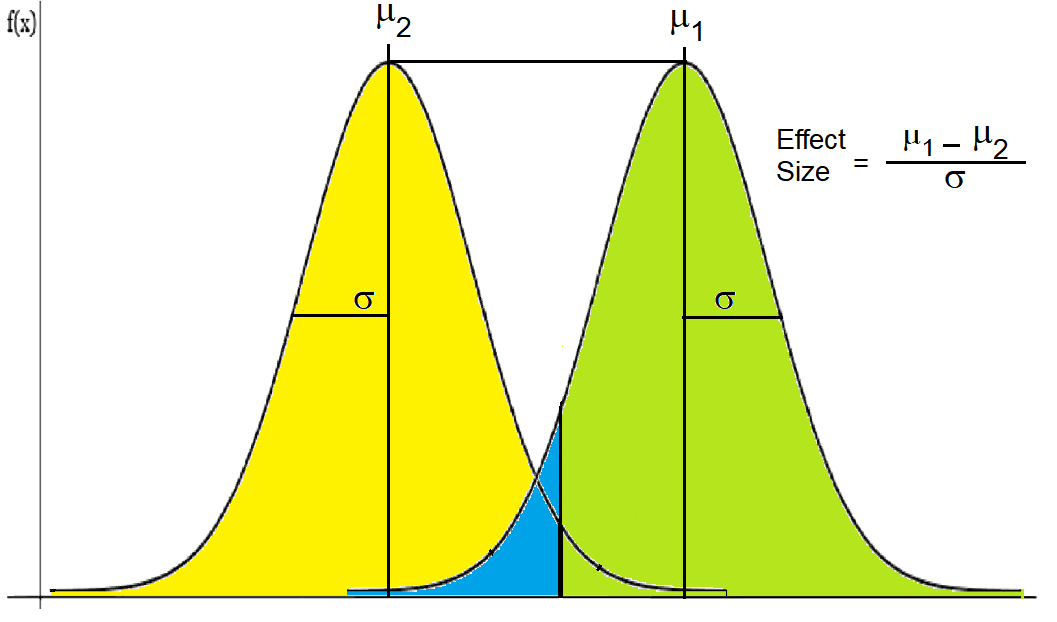
The effect size is useful because it can help you to understand if a difference is important or not. Sometimes
a difference can be very small and insignificant in real life. Other times, a difference can be very large and
have a big impact. The effect size can help you to decide if a difference is worth paying attention to or not.
There are different ways to calculate the effect size, depending on what you are comparing. Some common ways
are Cohen’s d and Pearson’s r. Cohen’s d tells you how many standard deviations apart from the means of two
groups are. Pearson’s r tells you how strong the relationship between two variables is. The effect size can
range from 0 to 1 or more. A higher effect size means a bigger difference or a stronger relationship.
The effect size is one of the statistics'resource that can be used to support the conclusions of hypothesis
tests. In some cases the significance level alone is insufficient for assessing the practical significance of
a given effect. It is not uncommon for an experiment to yield high statistical significance but lack
meaningful experimental significance. In such cases it is important to utilize another statistic that
complements the hypothesis test by evaluating the significance of observed differences in effects. In our
program the "Cohen's d" assesses the magnitude of the difference between observed effects related to the
combined standard deviation of each system. This enables the derivation of four possible outcomes: (1) the
hypothesis test exhibits high statistical significance and the differences between systems are experimentally
significant; (2) the hypothesis test demonstrates high statistical significance but the system differences are
not experimentally significant; (3) the hypothesis test lacks statistical significance yet the system
differences are experimentally significant; and finally, (4) the hypothesis test lacks statistical
significance and the system differences are not experimentally significant.
Randomization
Randomization means that things happen by chance and not by a plan. For example, if you flip a coin, you do
not know if it will be heads or tails. That is a random thing. A random sequence is a series of things that
have no order or pattern. When performing an experiment with animals many variables must be controlled in
order to ensure that the experimental results are not biased or invalidated. Some of these variables are:
weight of the animal, age, litter, hues, etc.
Although these variables, and many others, are under strict control by the researcher, we cannot guarantee
that all animals are statistically equal. So that a trend effect is not observed in relation to this or that
batch of animals it is important that the studies are developed with the random choice of animals, seeking to
reduce the experimental bias that may be present and unnoticed by the researcher.